UML Activity Diagrams: Modeling Process and Workflow
1. Overview
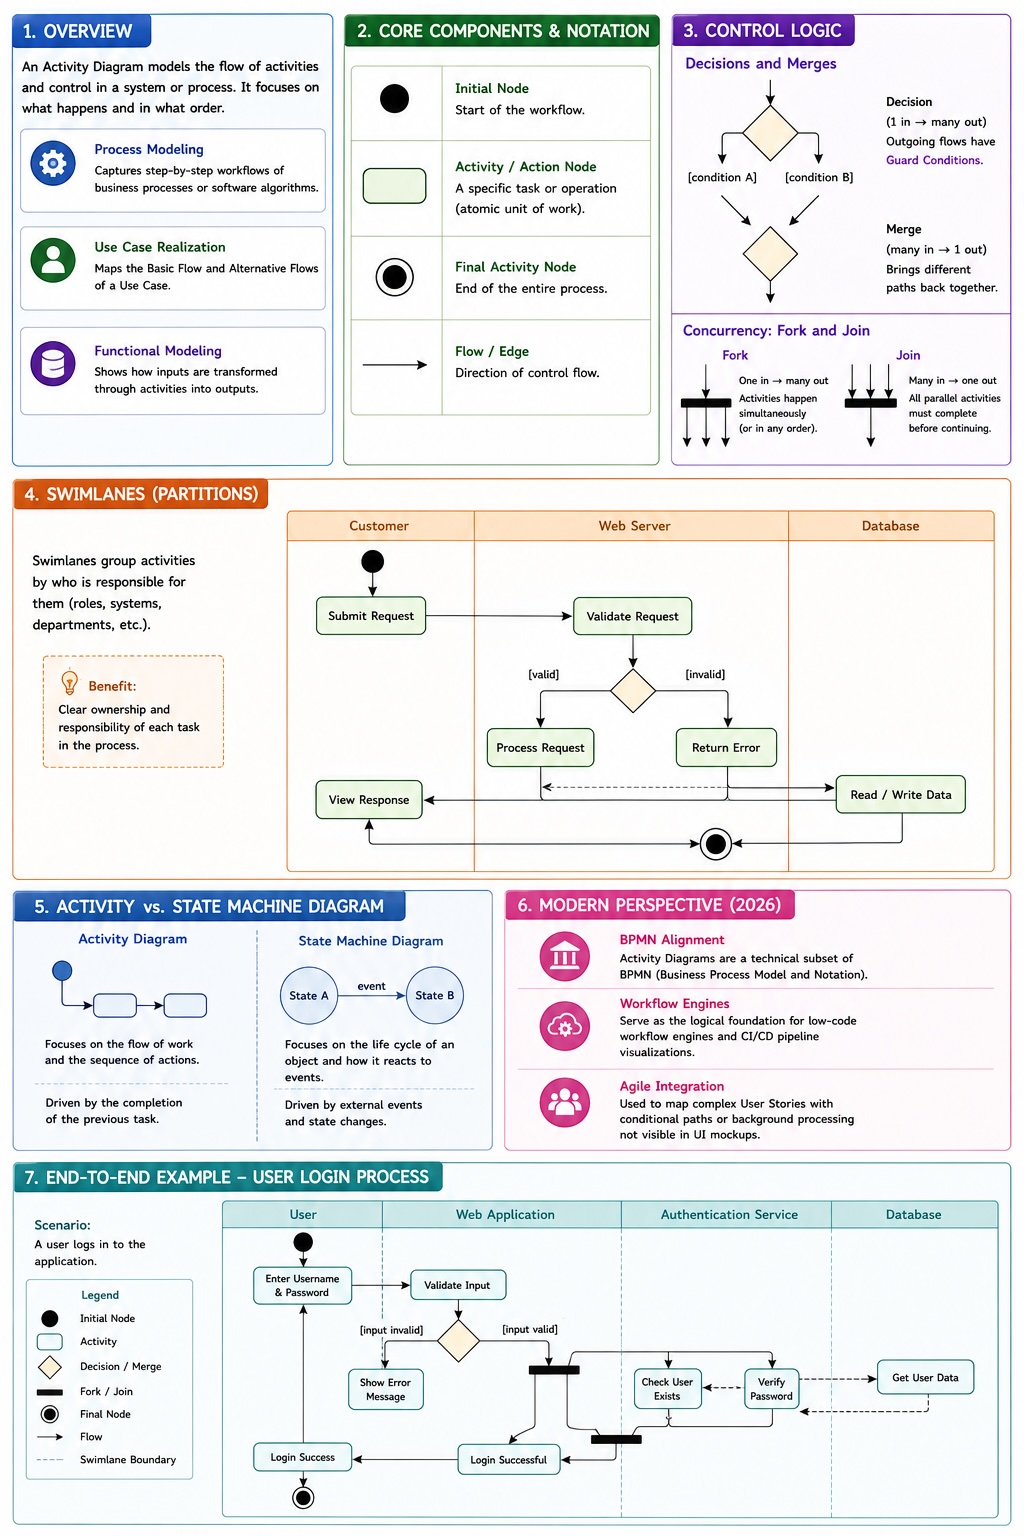
An Activity Diagram is a behavioral UML diagram used to illustrate the dynamic flow of control within a system. While a Sequence Diagram focuses on object interactions, an Activity Diagram emphasizes the flow of activities, logic branching, and concurrent processes.
- Process Modeling: Captures the step-by-step workflow of business processes or software algorithms.
- Use Case Realization: Frequently used to map out the "Basic Flow" and "Alternative Flows" of a specific Use Case.
- Functional Modeling: Represents the transformation of data (inputs) through a sequence of operations into outputs.

2. Core Components and Notation
Nodes
- Initial Node: A solid black circle representing the start of the workflow.
- Activity/Action Node: A rounded rectangle representing a specific task or operation. An action should be an atomic unit of work (e.g., "Validate Password").
- Final Activity Node: A "bullseye" (a solid circle inside another circle) representing the end of the entire process.
- Flow/Edge: An arrowed line showing the direction of control flow from one node to another.
3. Control Logic: Branching and Concurrency
Activity Diagrams excel at showing complex logic that involves decisions or simultaneous tasks.
Decisions and Merges
- Decision Node: A diamond with one incoming flow and multiple outgoing flows. Each outgoing flow has a Guard Condition (e.g.,
[is_valid]) in brackets. - Merge Node: A diamond with multiple incoming flows and one outgoing flow. It brings different logic paths back together.
Concurrency (Fork and Join)
This is a critical distinction from standard flowcharts, allowing the modeling of parallel processing.
- Fork: A heavy horizontal or vertical black bar with one incoming flow and multiple outgoing flows. It indicates that the subsequent activities happen simultaneously or in any order.
- Join: A heavy black bar with multiple incoming flows and one outgoing flow. All parallel activities must reach this bar before the process can continue.
4. Swimlanes (Partitions)
Swimlanes are used to group activities based on who is performing them (e.g., "Customer," "Web Server," "Database").
- They are represented as vertical or horizontal columns.
- By placing an action node within a specific swimlane, you clearly define the responsibility or ownership of that task.
5. Activity vs. State Machine Diagrams
It is common to confuse these two behavioral diagrams:
- Activity Diagram: Focuses on the flow of work and the sequence of actions. It is driven by the completion of the previous task.
- State Machine Diagram: Focuses on the life cycle of an object and how it reacts to external events (e.g., a "Ticket" moving from
OpentoResolved).
6. Modern Perspective (2026)
- BPMN Alignment: In modern business analysis, Activity Diagrams are often seen as a technical subset of BPMN (Business Process Model and Notation).
- Workflow Engines: These diagrams serve as the logical foundation for modern "low-code" workflow engines and CI/CD pipeline visualizations.
- Agile Integration: Teams use Activity Diagrams to map out complex "User Stories" that involve multiple conditional paths or background processing that isn't visible in a UI mockup.